
Reports
Know where every sale stands.
Build focused dashboards from the Contacts, Companies, and Deals already in your CRM. See which leads are moving, where deals stall, and who needs a follow-up, then open the records behind the number.
Sales dashboards that lead back to the customer record.
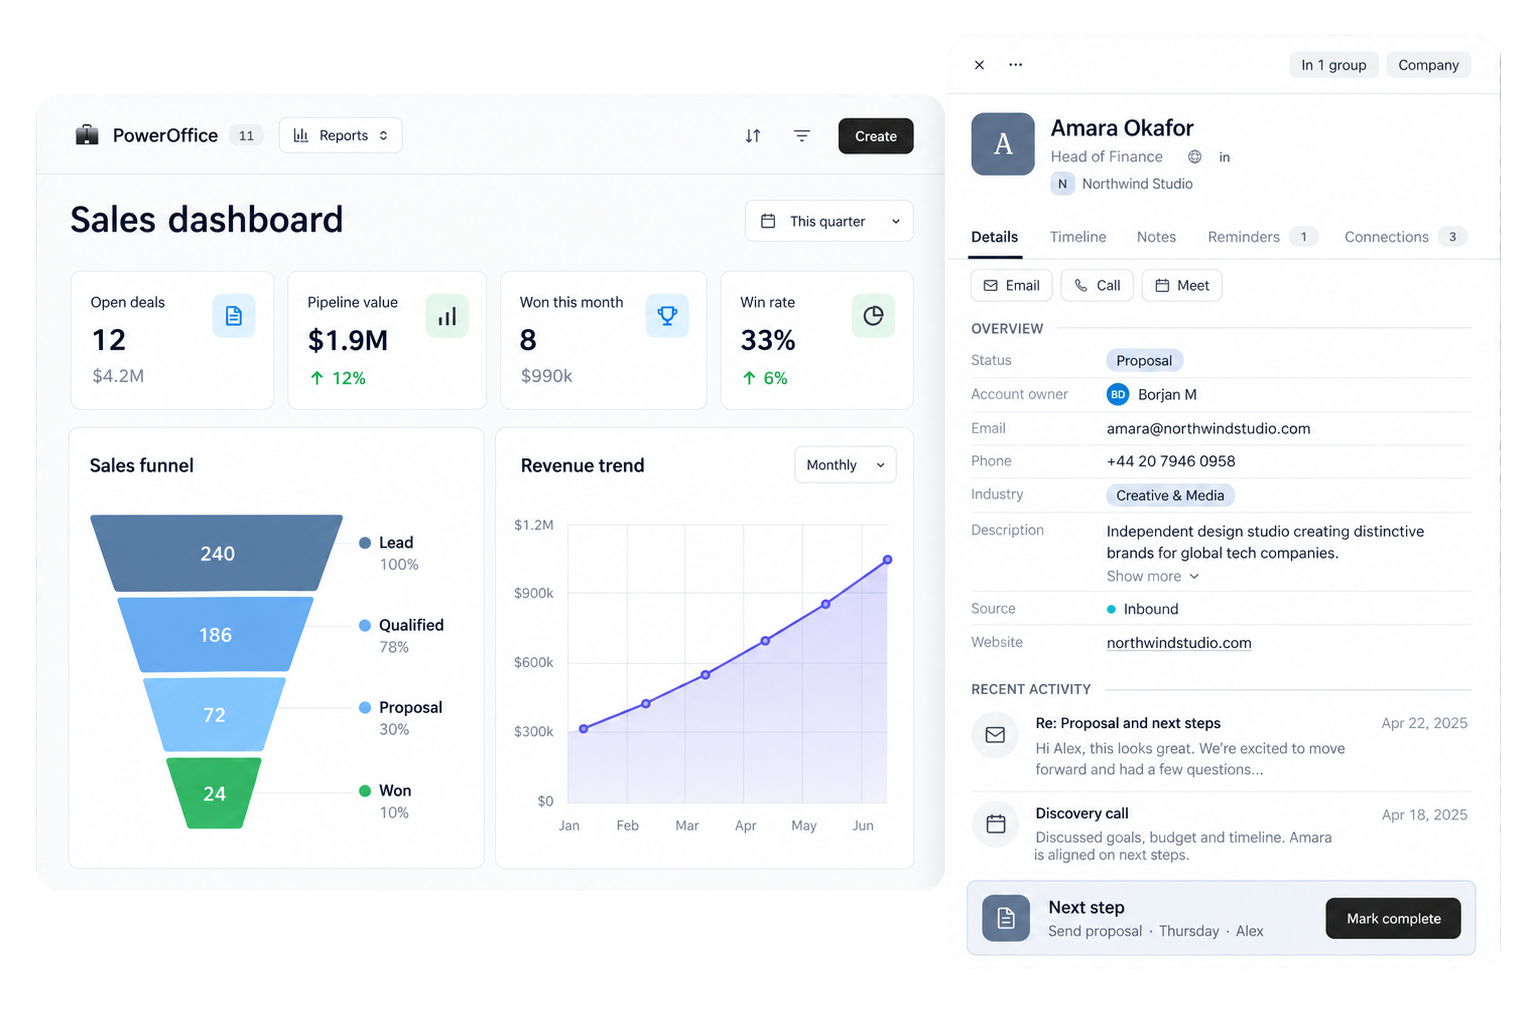
- See the funnel quickly.Know what is new, moving, stuck, or won.
- Use your sales fields.Measure stages, owners, values, dates, or sources.
- Act on the record.Move from a chart to the follow-up behind it.
Start with the work you already do
Make the numbers useful in the moment.
Reports give your team one shared view of the work. Start with a sales question, choose the information behind it, and keep the answer connected to the records that need attention.
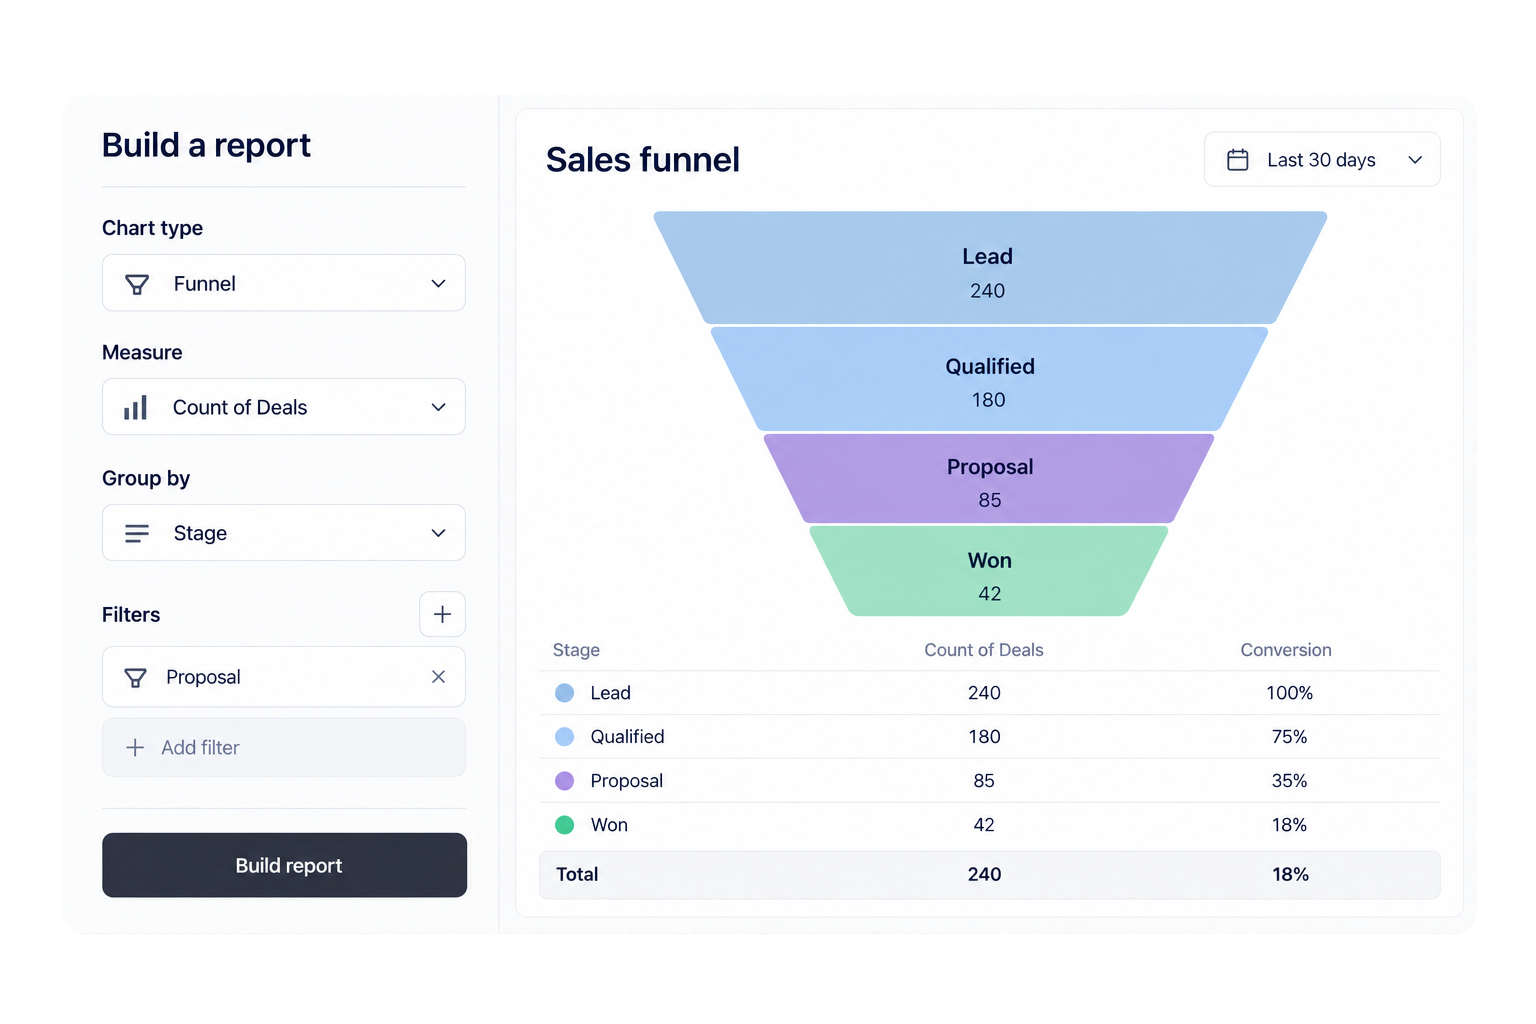
Sales funnel
See your sales funnel at a glance.
Keep open deals, pipeline value, win rate, and revenue movement together so the next review starts with the same picture.
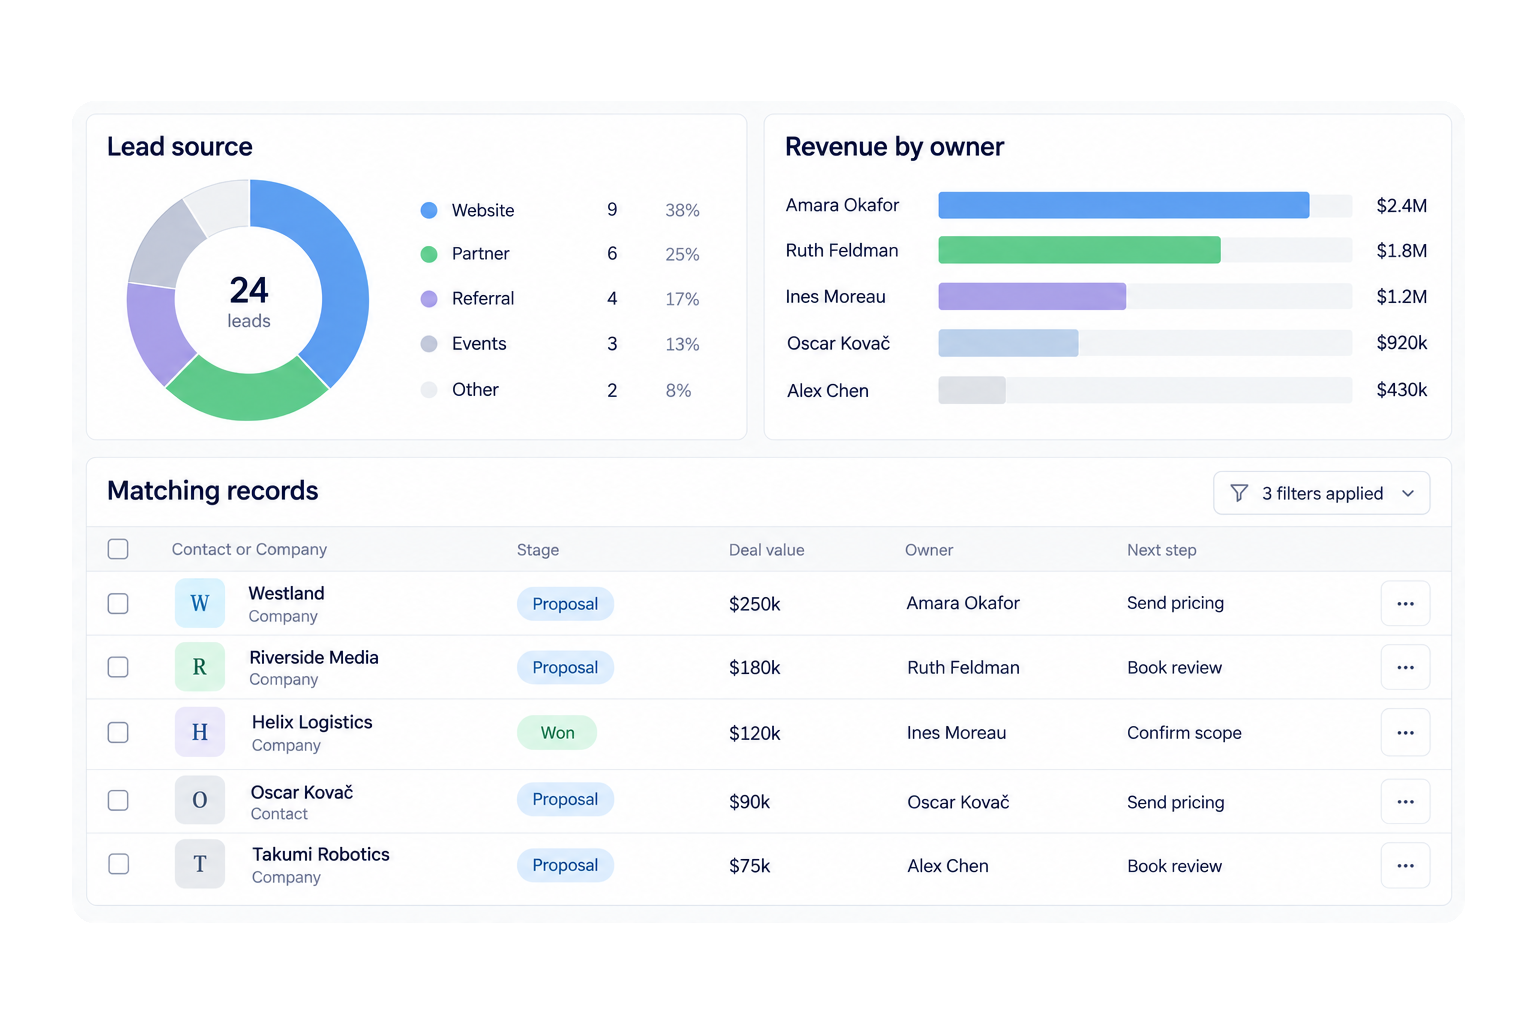
Focused chart
Find the pattern behind the number.
Compare stages, owners, sources, or time with the chart that makes the answer easiest to see.
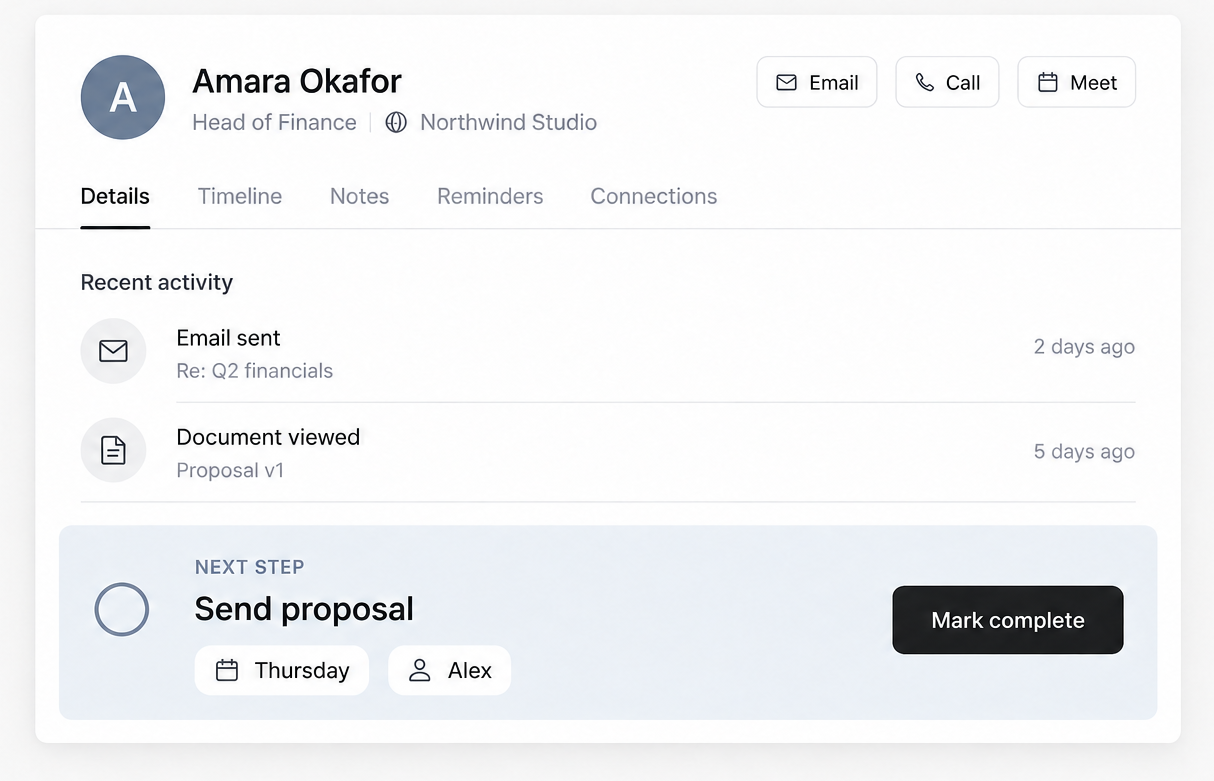
Drill-down
Click straight into the follow-up.
Filter a chart by stage, owner, source, or date and open the matching Contacts, Companies, or Deals that need action.
Make it fit your business. A report should answer a sales question and take you to the work behind it. SoftSync keeps dashboards, charts, and the Contacts, Companies, and Deals they describe in one connected workspace.
A simple way to use it
Build a useful report in four steps.
Start with the review your team already has, then make the answer easier to see and act on each time.
- 01Open Reports
- 02Choose the group and information to measure
- 03Pick a chart or start with a template
- 04Open the records behind the result
Questions, answered
A few things people ask before they start.
Use the sales information your team already has to make the next decision clearer.
What can I put on a report?
Add charts for the questions your team asks: how many Deals are open, where the funnel narrows, which owner has the most value, which source converts, or how revenue changes over time.
Do I need to build a chart from scratch?
No. Start with Pipeline by stage, Revenue by source, Revenue trend, Largest customers, or Work by status, then adjust the fields and filters to match your process.
Can I use my own fields and stages?
Yes. Reports use the groups, objects, fields, and stages in your workspace. Your dashboard changes with the way your team already tracks sales.
Can I open the records behind a chart?
Yes. Select a chart segment or use its filters to open the matching Contacts, Companies, or Deals in the underlying view.
Ready when you are
See your sales day in SoftSync.
See a sales dashboard built from the records your team already works in.